Understand where Columbus is going—and what it means for where you live.
Explore housing costs, neighborhood change, local decisions, restaurants, events, and practical community resources.
- AmercrestareaCity of Columbus neighborhood hub: demand shifts, development, and renter/buyer context.
- Arena DistrictareaCity of Columbus neighborhood hub: demand shifts, development, and renter/buyer context.
- BerwickareaCity of Columbus neighborhood hub: demand shifts, development, and renter/buyer context.
- BexleyareaFranklin County municipality hub: inventory, demand, schools, and development as we publish.
- BlacklickareaFranklin County CDP or place name aligned with major listing sites (e.g. Zillow Franklin browse).
- Blacklick EstatesareaFranklin County CDP or place name aligned with major listing sites (e.g. Zillow Franklin browse).
Start with German Village, Dublin, average rent, zoning, or festivals.
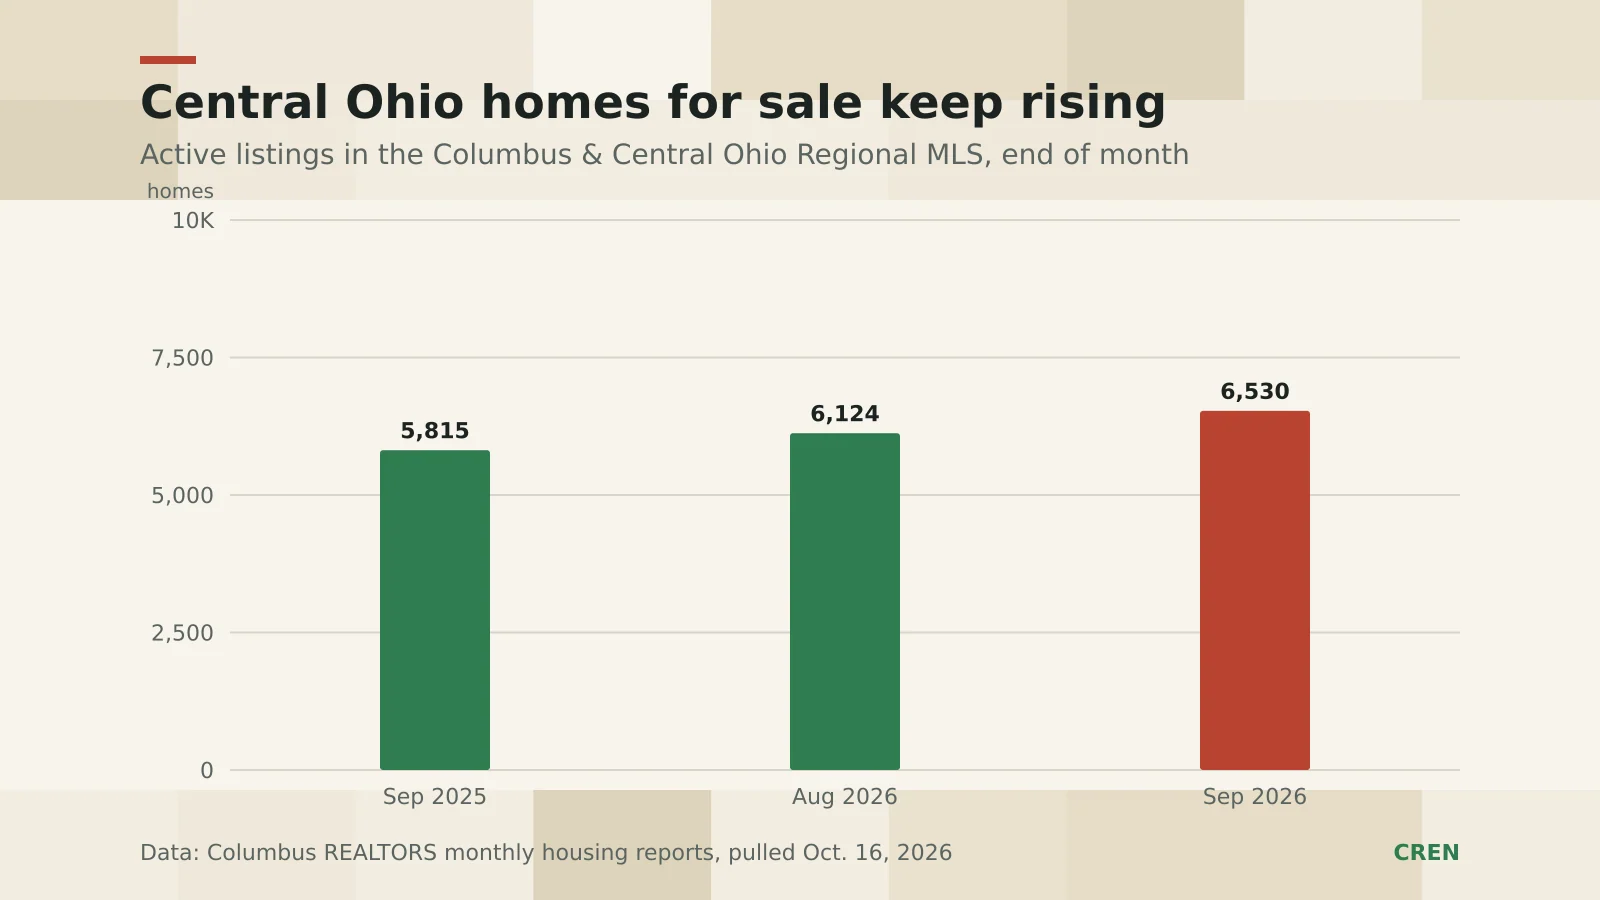
Central Ohio Had More Homes for Sale and Fewer Sales in September
The central Ohio housing market added listings but lost sales in September 2026: inventory rose 12.3% to 6,530 as closed sales fell 5.7%, per Columbus REALTORS®.
Read the story →Decision tools
Start with the questions Columbus movers already ask
Area fit, renter due diligence, buyer budget reality, and local change get a direct path.
Where should I live?
Compare areas by budget, commute, schools, parks, walkability, and what to verify before deciding.
Open renter checklistWhat should I check before renting?
Run through fees, utilities, maintenance, A/C, parking, package security, reviews, and public-record checks.
Compare buyer pathsCan I afford to buy here?
Use price-band reality, buyer checklists, and nearby substitutes before you commit to one neighborhood.
Open Development WatchWhat changed in this area?
Track development, rent pressure, public decisions, local businesses, and neighborhood tradeoffs.
Area Reality Checks
Proof-cohort hubs
Use these first for concrete tradeoffs, verification prompts, nearby substitutes, and area alerts.
What’s new
Today in Columbus
Housing, community change, and useful local reporting—without an endless article wall.
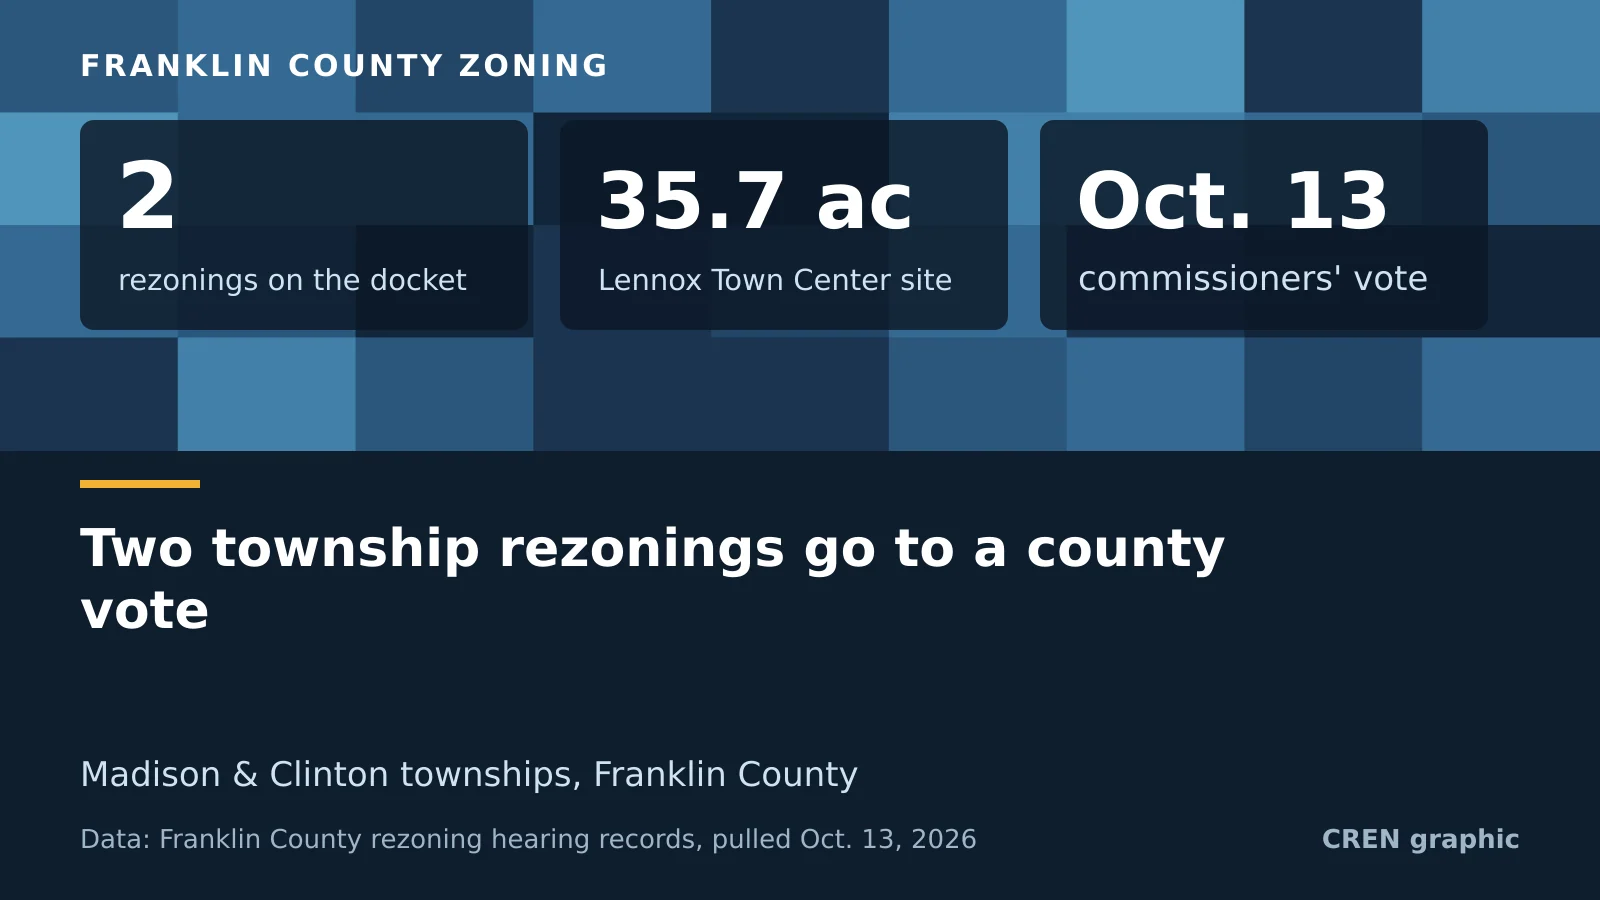
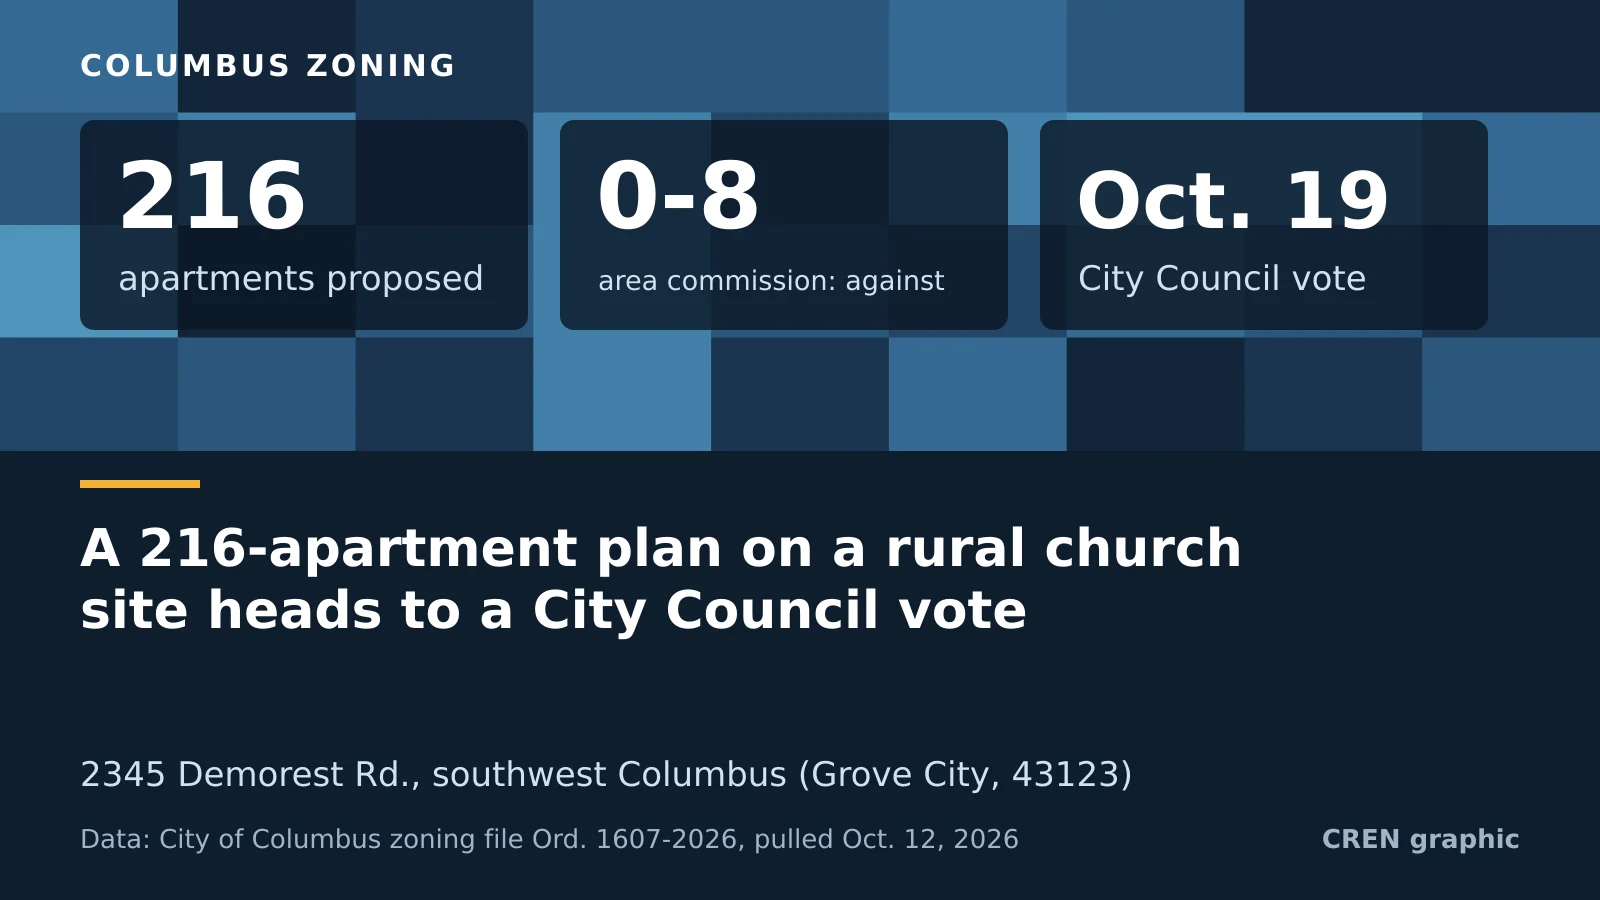
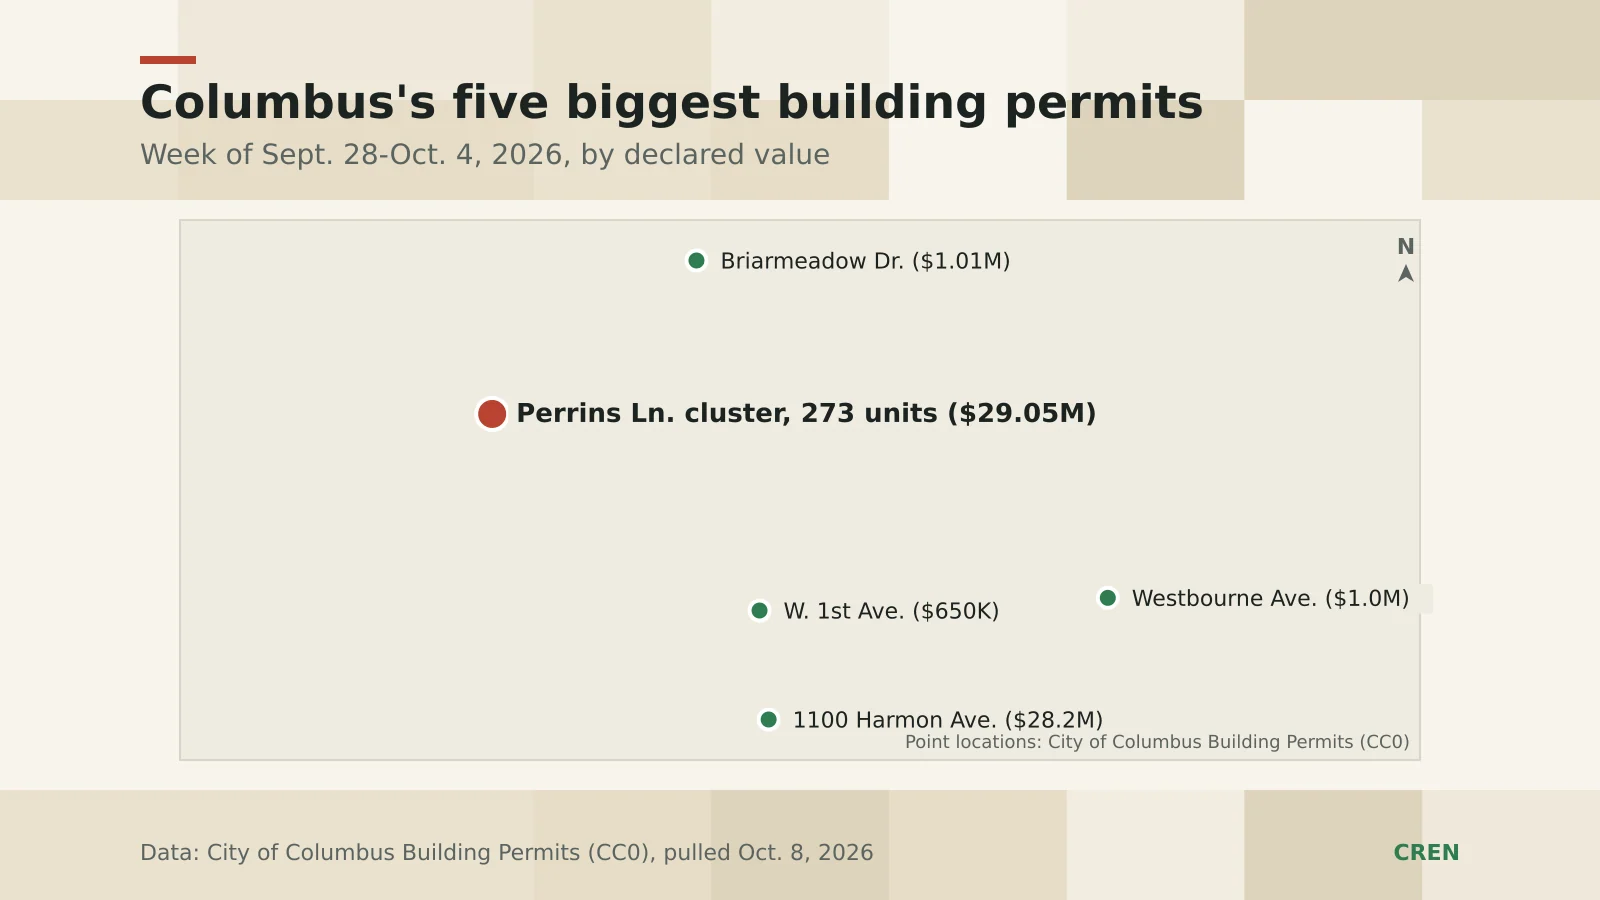
Enjoy where you live
Local living, made useful
Restaurants, events, annual traditions, parks, and community life near home.
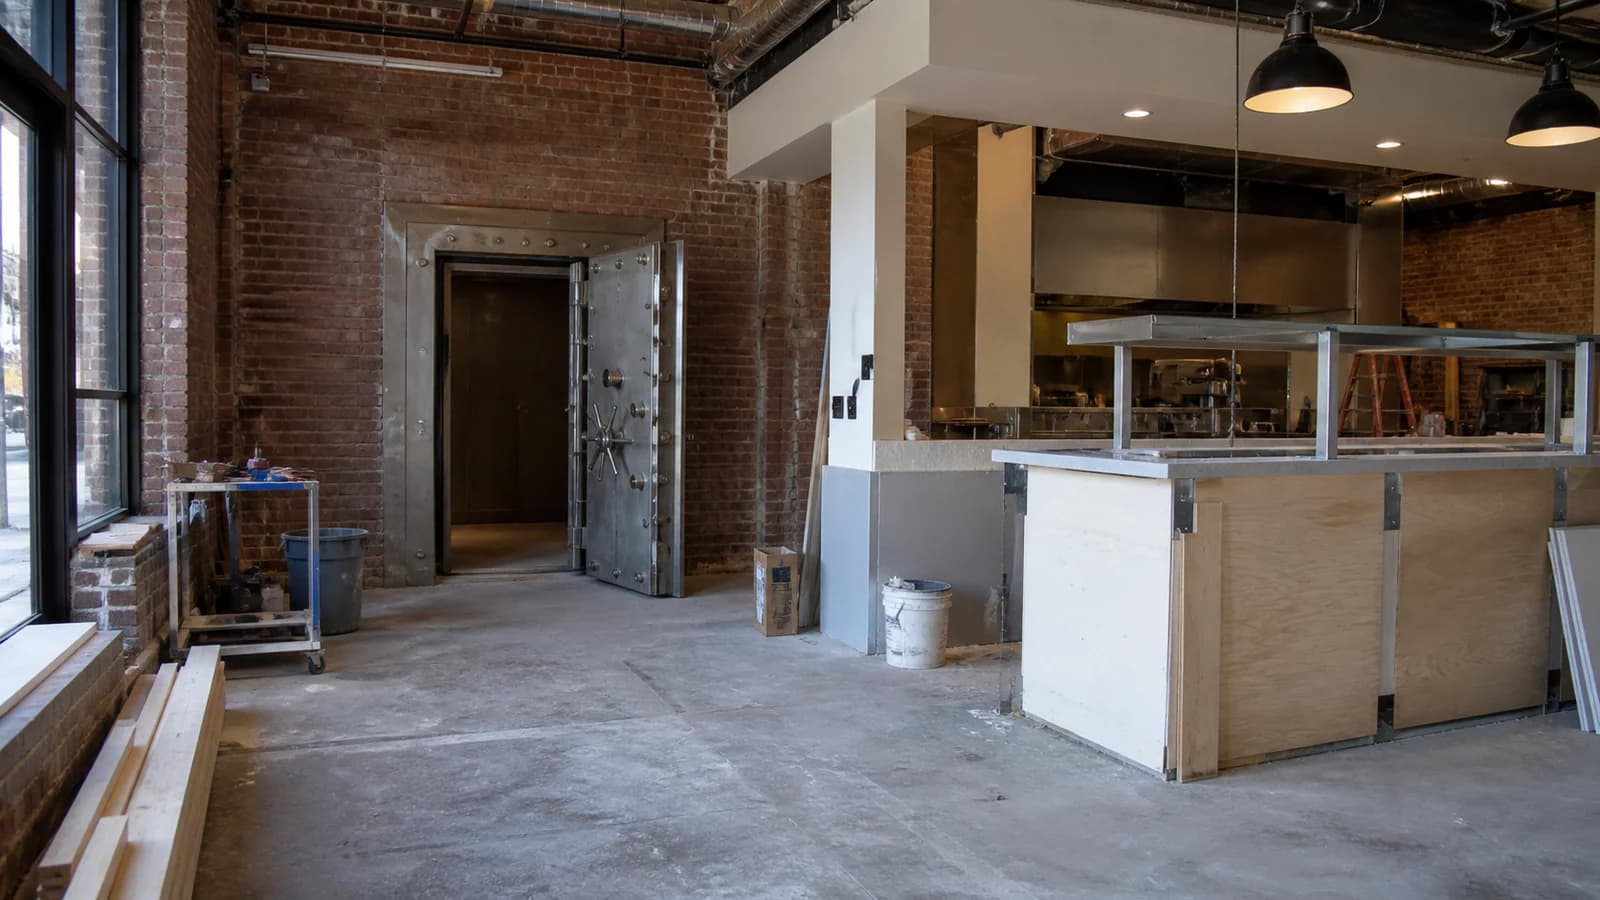
AI illustration · not the actual property or event
Lifestyle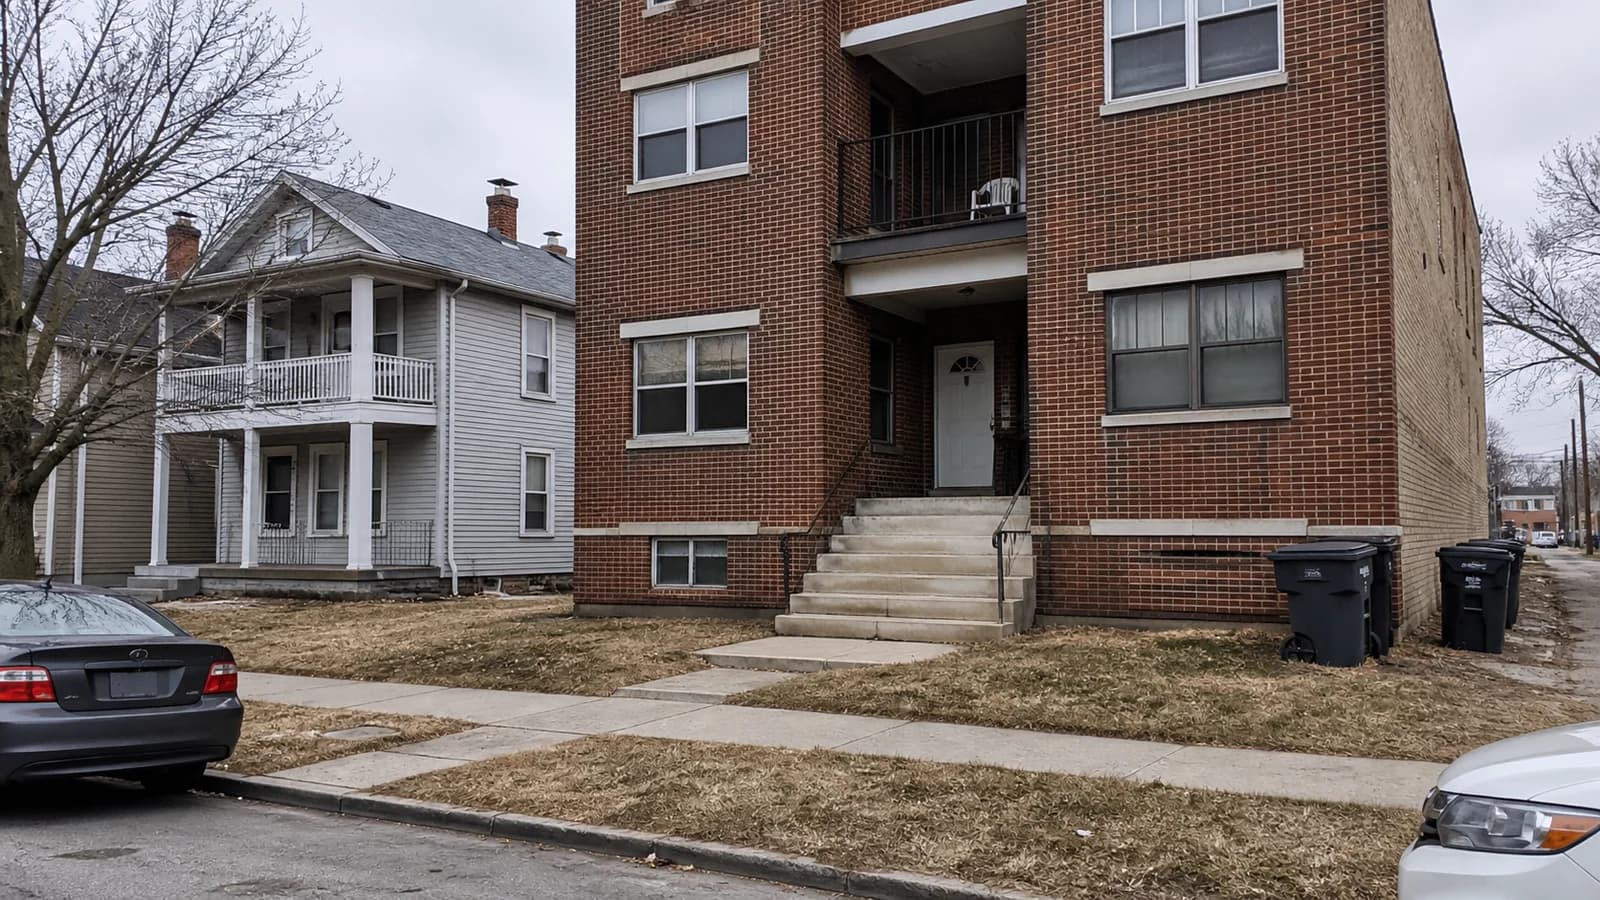
AI illustration · not the actual property or event
Lifestyle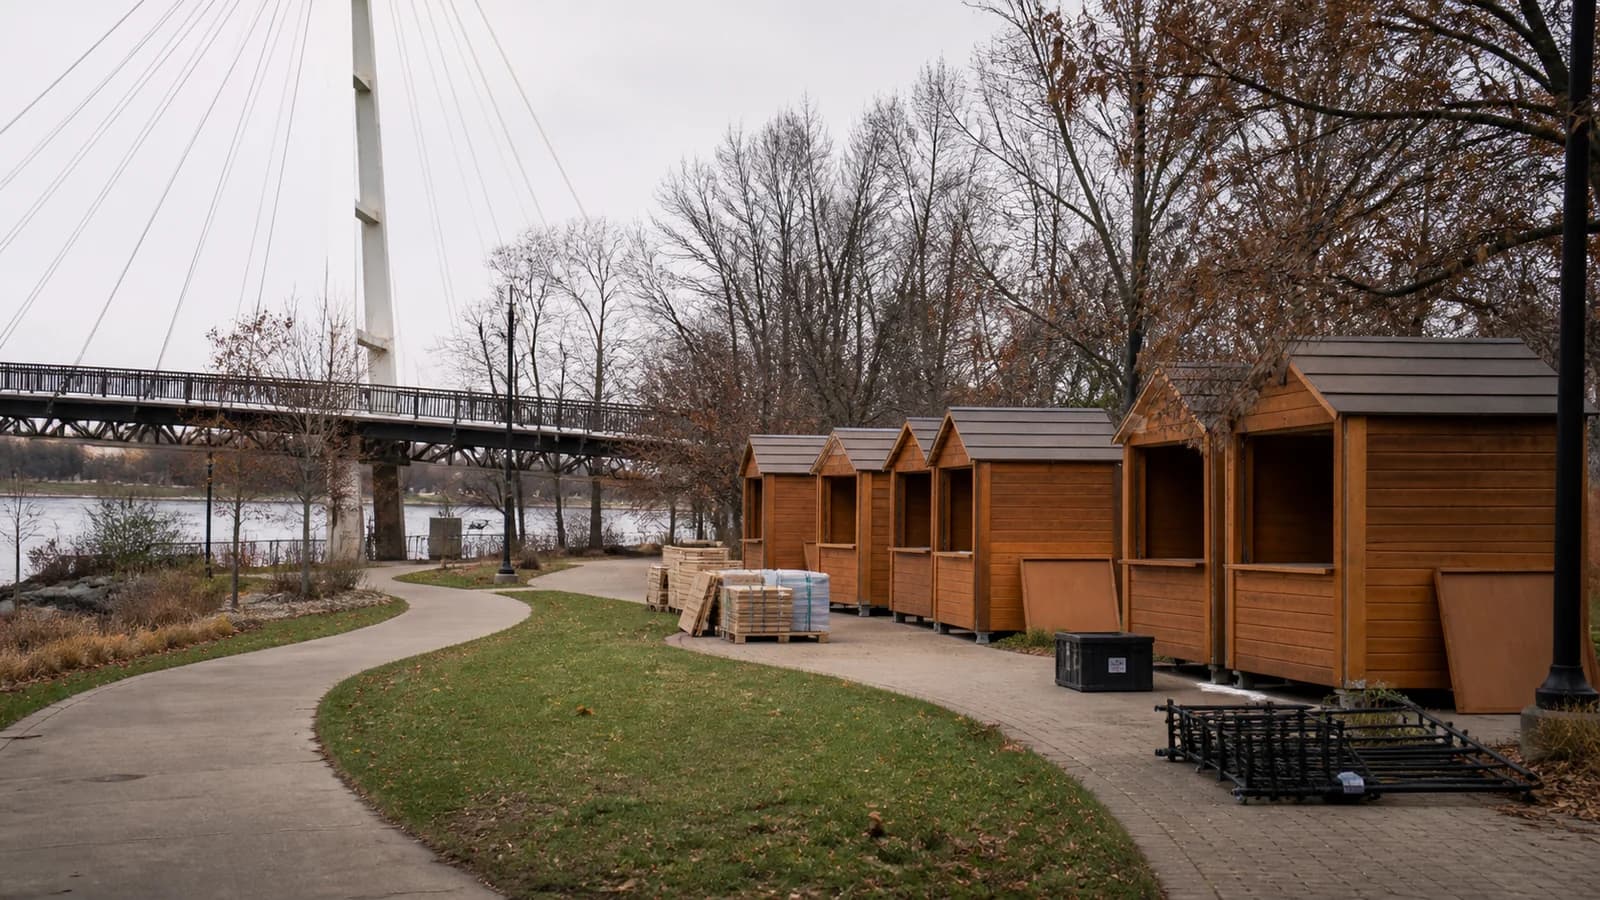
AI illustration · not the actual property or event
Lifestyle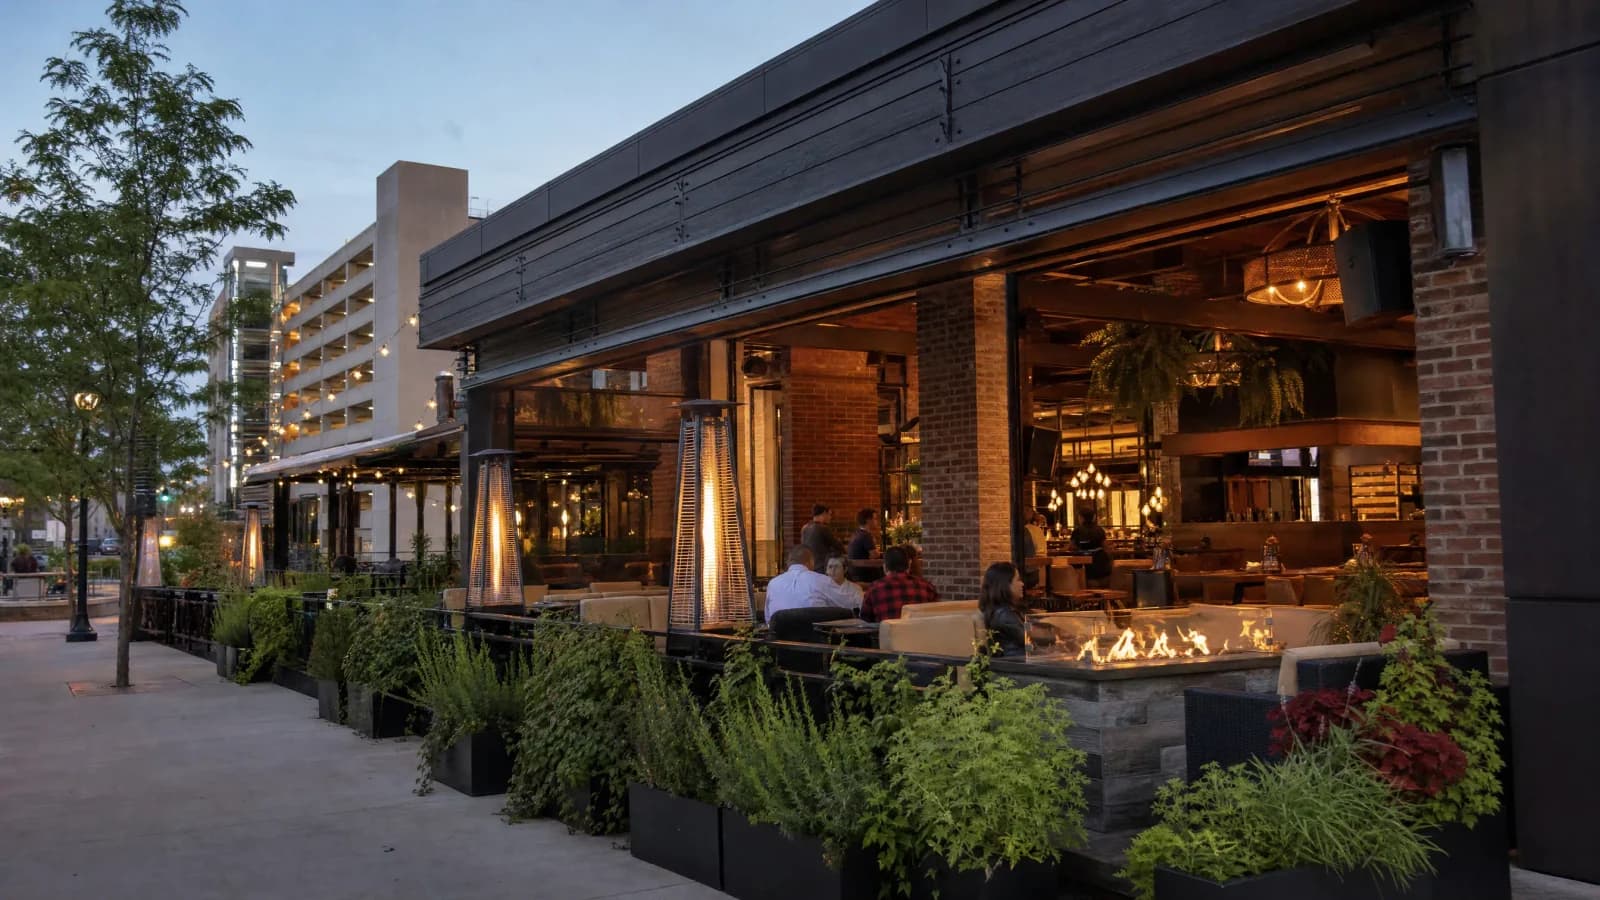
AI illustration · not the actual property or event
LifestyleNear you
Follow an area
See housing, development, restaurants, events, politics, and resources in one local briefing.
Typical value and rent: Zillow Research · September 2026, where published for the area. † and all year-over-year, days-listed and inventory figures are CREN estimates without an attached source. See sources and data
Your questions shape the reporting
What should CREN explain about your area?
Ask about a development, rent change, council decision, restaurant opening, public resource, or annual event.