Franklin County Weekly Sales Need Context as Rates Rise
A Franklin County weekly transfer report showed a $329,900 median, but it cannot by itself establish that the housing market cooled as mortgage rates rose.
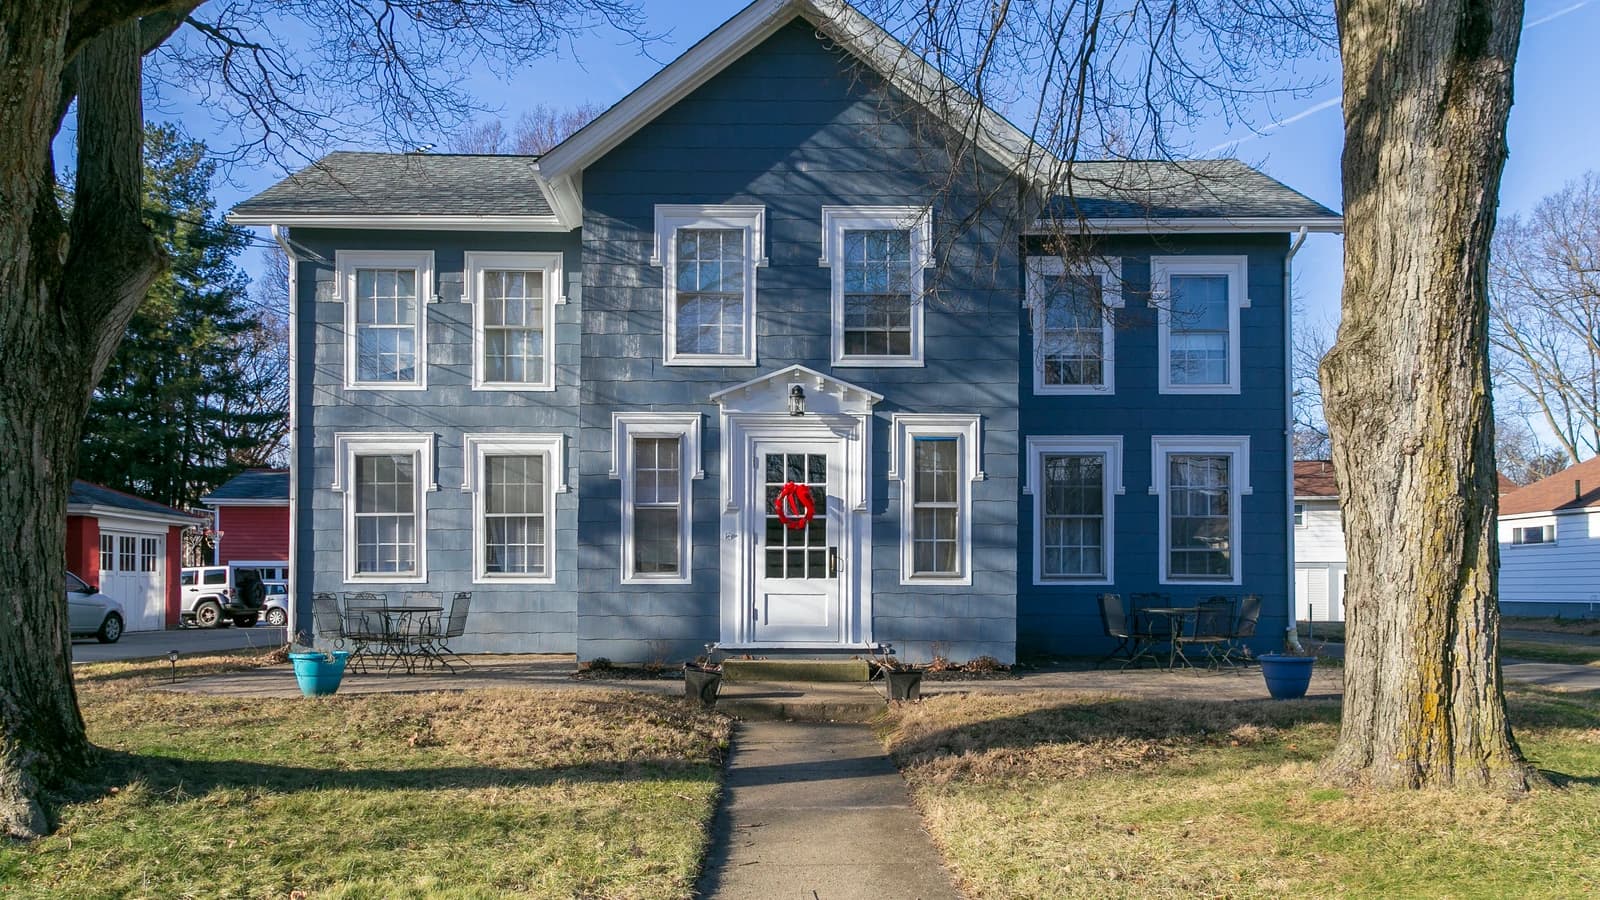
Franklin County recorded a $329,900 median residential sale price for transfers reported from July 31 through August 6, 2026, while the national 30-year mortgage average reached 6.69%. The figures are useful snapshots, but they do not prove that higher rates caused county sales or prices to cool.
What the county transfer report measured
The Franklin County Auditor’s weekly report listed 498 residential sales and an average sale price of $391,108 for the reporting week. Because the auditor compiles recorded transfers, the report describes closings that reached the public record rather than contracts newly signed during that week.
That lag is important when considering mortgage rates. Many purchasers whose deeds appeared in early August would have agreed to their transactions and arranged financing weeks earlier. A rate published during the closing week cannot automatically explain the price or number of those transfers.
The difference between the average and median also signals a wide price distribution. A relatively small number of expensive sales can pull the average upward, while the median identifies the midpoint of the reported transfers.
The regional comparison is not like for like
The Columbus REALTORS June statistics put the Central Ohio median at $352,000 and counted 3,100 home sales across its regional MLS. That geography extends beyond Franklin County, and the monthly window is much longer than the auditor’s weekly report.
The two medians differ by $22,100, but that subtraction is not a measure of month-to-month depreciation. It compares different places, periods and property mixes. Outer counties with more new construction can change the regional median, while a single week of Franklin County deeds can shift with the mix of homes closing.
The previous version treated the gap as evidence that Franklin County trailed the region. The records support only a descriptive comparison, not a trend or causal conclusion.
Mortgage rates were higher, but causation is unproved
Freddie Mac’s survey archive shows the average 30-year fixed rate at 6.69% on August 6, up from 6.66% on July 30. The rate eased to 6.67% on August 13.
Freddie Mac’s Primary Mortgage Market Survey is a national measure based on conventional conforming purchase applications. It is not a count of Franklin County borrowers, and individual offers vary by credit, loan type, points and other terms.
Higher borrowing costs generally raise the monthly payment associated with the same principal, but this weekly evidence does not isolate how much local demand changed because of the rate movement.
What would demonstrate cooling
A credible cooling claim would require several comparable periods showing changes in closed sales, prices, marketing time and inventory within the same geography. Contract dates or rate-lock dates would also be more informative than pairing a deed-recording week with the rate published that week.
The next useful checkpoint is the auditor’s subsequent weekly reports alongside the next monthly Franklin County series from the same provider. Until a consistent run develops, the August report is best read as a snapshot of recorded transactions, not proof of a turning market.
Thinking about selling?
Get a free offer on your Columbus home from local buyers. No 6% commission. On a $300,000 home that is roughly $18,000 that stays in your pocket. You pick the closing date.
Get my free offerThe offer is free and there is no obligation.