Bexley Spring Sales Rose, but One Month Is Not a Trend
Bexley’s spring sales data show a sharp median-price increase, but the small local sample and changing mix of homes make broad value claims unreliable.
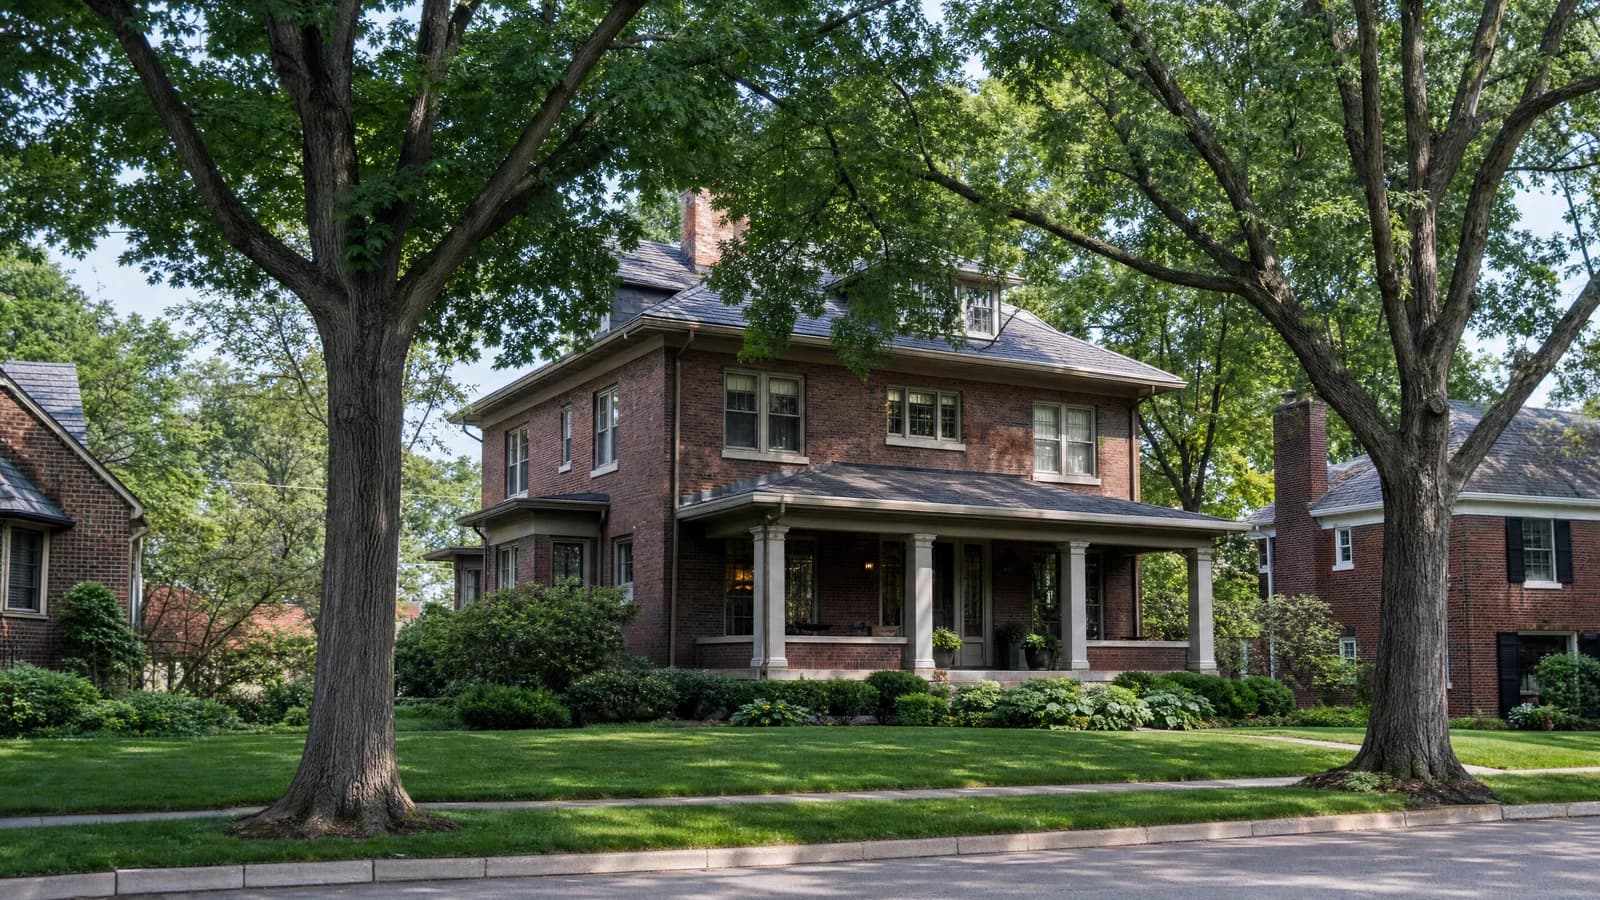
Bexley’s spring 2026 sales were expensive and competitive, but the latest data do not support a simple claim that every home gained the same amount. Redfin’s three-month measure showed a higher median price, while its marketing-time measure was slightly slower than a year earlier.
What the latest snapshot shows
For the three months ending May 2026, Redfin’s Bexley dataset reported a median sale price of $749,302, up 18.0% from the comparable period a year earlier. It counted 46 May sales, down 16.2% year over year, and an average of 33 days on market compared with 31 days.
Those figures contradict the original article’s claim that homes were selling faster based on an earlier snapshot. They also show why a live market page needs a clear measurement date: the values change as transactions enter the reporting window.
Median price is not home appreciation
A median sale price is the midpoint of homes sold during a period. It can rise because more large or renovated homes sold, even if no individual property appreciated by the same percentage. Bexley’s limited transaction count makes that mix effect especially important.
Zillow publishes a different measure. Its Bexley home-value page uses a modeled typical value rather than only the prices of homes that closed during one month. The two products answer different questions and should not be combined as if they use the same sample or method.
The longer baseline
The Columbus REALTORS 2025 annual report provides a separate full-year community view derived from the regional multiple-listing service. A yearly series is less sensitive to one unusual month, although its coverage and definitions still differ from Redfin and Zillow.
CREN’s comparison of the three sources is the main finding: Bexley remained a high-price, active market, but the size and direction of the reported change depend on the time window and metric. None of the sources proves that school reputation, walkability or scarce land caused a particular price movement.
What to watch next
The next useful comparison is another rolling three-month period using the same Redfin geography, paired with the full-year MLS series when it becomes available. Sales count, median price, days on market and sale-to-list ratio should be read together.
Readers evaluating a particular house still need comparable sales matched for location, size, condition and date. Citywide medians describe the transactions in the dataset, not the value of every Bexley property.
Follow Bexley
Get Bexley market, housing, school/context, and local-life alerts.
CREN uses this preference for email updates and measurement. It does not create a public profile.